
Who This Is For
This guide is for frontend and backend developers building custom map interfaces for web or mobile applications—whether you’re working on real estate platforms, logistics dashboards, city planning tools, or any application that needs to render geographic boundaries at scale. If you’re struggling with map performance as your polygon count grows, or looking to architect a production-grade geospatial system, these techniques will help you scale gracefully.
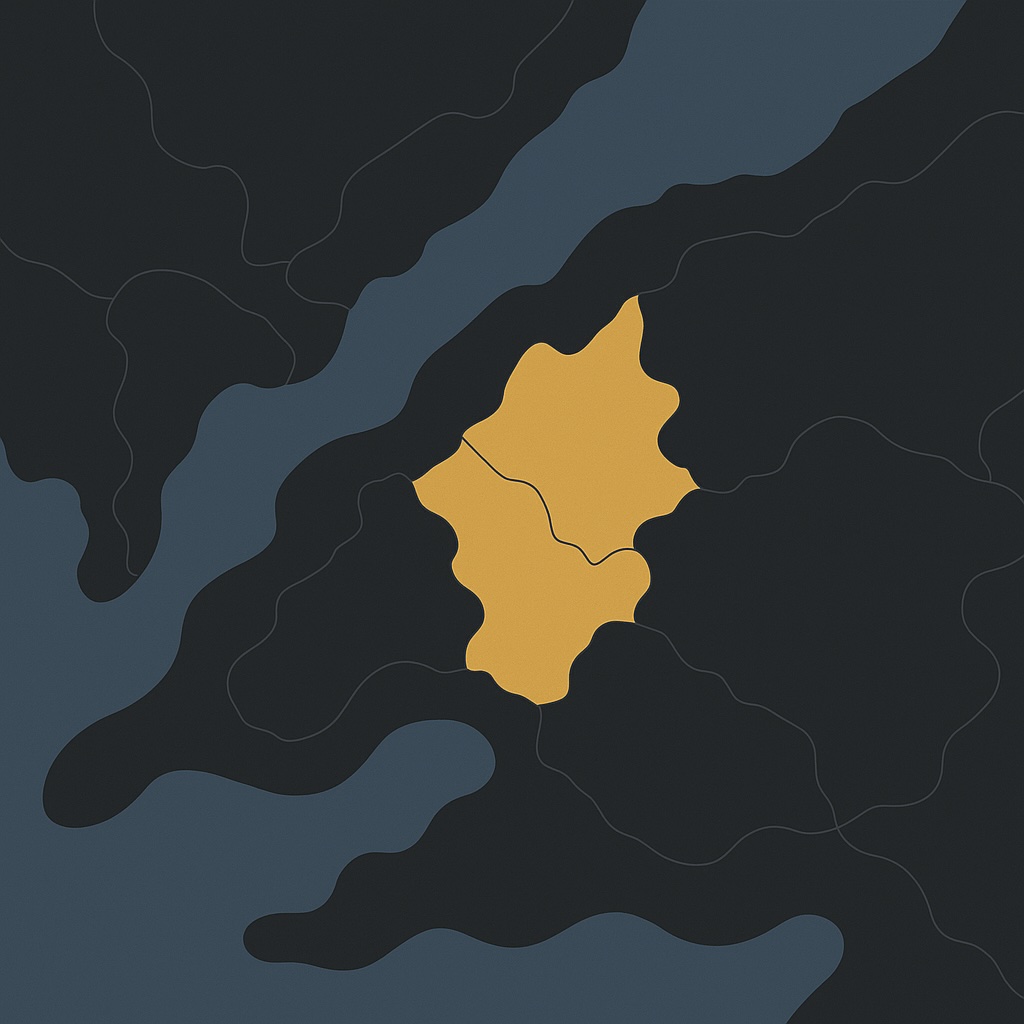
If you’re building a client application, whether it’s a real estate platform, a city insights dashboard, or a logistics planning tool, that uses a custom map view to display regions or places of interest shaded by polygons, you’ve likely hit a familiar wall.
As your map starts showing hundreds of polygons, each representing neighborhoods, zones, or clusters, it suddenly becomes a balancing act between performance, accuracy, and server load. Every pan or zoom event can trigger dozens of expensive spatial queries, choking your backend and frustrating users with slow map redraws or flickering regions.
The question is: how do you keep the experience buttery-smooth without hammering your backend every time someone moves the map?
There’s no single silver bullet. This problem sits at the intersection of frontend rendering efficiency, network optimization, and smart data partitioning. But with a combination of disciplined caching, intelligent fetch logic, and a thoughtful distinction between what’s static (geometry, metadata) and what’s dynamic (live data, overlays), you can make your maps scale gracefully, even as you expand to larger geographies or more granular regions.
The rest of this post breaks down strategies, architectural patterns, and code-level ideas that can help you achieve this — without having to over-engineer your backend or compromise on interactivity.
I’ll explore the low hanging fruits first: simple measures you may implement for immediate results, and then delve into long-term and higher effort techniques that would offer benefits at scale.
Lowest Hanging Fruits
1. Cache everything that can be cached
Start with caching.
Every map tile, polygon, or rendered region boundary you serve should be cacheable at two levels:
- On your CDN (for global edge delivery)
- In the browser (for fast revisits)
If these boundaries don’t change every minute, there’s no reason to hit your database for them repeatedly.
Even short-lived CDN caching (say, 24 hours) can take a huge load off your backend.
2. Render progressively: know when to show what
When the map is zoomed out to show an entire country, don’t bother with the details of individual cities or neighborhoods.
Instead, show broader zones — one polygon per active city or region.
Then, once a user zooms in beyond a certain threshold, start loading the finer-grained data (the wards & neighbourhoods).
You can even tune this zoom threshold per city, depending on how dense or complex the polygons are.
Think of this like the old atlas books: the first page showed the entire country with major cities marked. Each city had an index number pointing you to a detailed page later in the book. When you turned to that page, you’d see the zoomed-in city map with street-level detail—along with a small inset showing where this city sits in the larger country map.
The atlas didn’t print every street of every city on the country-level page. That would be unreadable clutter. It used progressive disclosure: showing only the detail humans could actually perceive and consume at each scale.
Your map should work the same way. At zoom level 5, users can’t distinguish individual neighborhoods—so don’t load them. At zoom level 12, they can—so now you fetch and render that detail. This is essentially a progressive rendering strategy, and it dramatically reduces how much data the client queries & deals with at once.
3. Cache polygons intelligently on the frontend
Once a ward polygon is fetched, keep it in local memory.
Next time the user pans or zooms within the same area, reuse it instead of refetching.
Design a cache ID that combines the ward’s coordinates and zoom level.
If you do this right, you can confidently serve data from cache for up to a day without worrying about staleness.
Yes, it adds some complexity, but it’s worth it. A well-designed in-memory or browser storage cache saves you hundreds of redundant network calls.
4. Fetch smartly: debounce, hysteresis, and prefetch
Even with caching, you need to prevent unnecessary fetch storms. Adopt these principles for your API requests:
Debounce fetches
Only trigger a new API call a short while after the map has stopped moving (say, 200–500 ms). That’s long enough to filter out rapid pans and zooms.
Use hysteresis
Minor movements within 10–20% of the viewport shouldn’t trigger a new fetch. Only when the map has moved significantly beyond that threshold should you query new data.
Cancel stale requests
If a new fetch starts before the old one finishes, cancel the old one. No point rendering something the user’s already moved past.
Fetch slightly beyond the viewport
Ask the backend to return polygons about 20% beyond what’s visible. That way, along with hysteresis control, small drags won’t need a network call at all — the new area’s already there.
Together, these make the map feel instant, even when the data is heavy.
When to Move Beyond Quick Wins
The techniques above will get you surprisingly far—often handling tens of thousands of polygons with minimal backend strain. But as your application scales to millions of regions, supports real-time updates, or needs to serve global audiences with sub-second latency, you’ll need to rethink your architecture.
That’s when the following long-term techniques become essential. Unlike the quick wins above, these require upfront engineering investment and architectural changes—but they’re what separate consumer-grade map experiences from enterprise-scale geospatial platforms.
Long Term Techniques
1. Vector tiles
Eventually, you’ll outgrow the “fetch by bounding box” model. That’s when you move to pre-rendered vector tiles1.
This is how large geospatial map data products handle it: The entire globe is split into small square tiles at multiple zoom levels, each tile containing just the polygons needed for that level of detail.
Tiles are named predictably based on latitude, longitude, and zoom level. They’re static files cached worldwide on edge CDNs — no dynamic queries required.
Your frontend simply computes which tiles are visible and fetches them. It’s deterministic, reproducible, and infinitely scalable. You can still overlay live data (like availability or highlights) dynamically.
The secret isn’t just in the rendering — it’s in designing a strong, reproducible cache key for every tile.
2. Geometry Simplification and Adaptive Precision
When displaying polygons (e.g., city boundaries or zones) at low zoom levels, you don’t need every vertex. Platforms like Google Maps and Mapbox precompute multiple simplified versions of the same polygon using algorithms like:
- Douglas–Peucker2
- Visvalingam–Whyatt3
- Or Mapbox’s own simplification pipelines (tippecanoe4, mapshaper5)67
Each zoom level uses a lighter geometry, dramatically reducing render time and bandwidth.
Example: At zoom 6, a city polygon may use 100 points; at zoom 14, the same polygon might use 10,000.
Your frontend can request the version appropriate to its current zoom level, or you can pre-bake them into your vector tiles.
3. Spatial Indexing and Quadtrees
Big players almost never perform naive “bounding box” database queries on every drag or zoom. They use prebuilt spatial indexes. Typically quadtrees, R-trees, or geohash grids that let them instantly find all polygons overlapping a viewport.
- Uber’s H389 is a popular open-source example: it divides the earth into hexagonal cells10.
- Airbnb uses geohashing and cell-based indexing to quickly retrieve listings in the visible map region without scanning the entire dataset.
This lets them:
- Instantly determine which tiles or features to load.
- Cache results predictably at the cell level.
- Perform deterministic cache lookups even with constantly changing data.
Spatial indexing is the architectural backbone behind efficient “fetch-by-viewport” patterns.
4. Delta or Patch-Based Updates
Instead of refetching full polygon data when something changes, large apps send diffs or patches: small payloads describing what’s new or removed.
For example:
- Google Maps’ live traffic or business density layers update via protobuf streams that patch existing vector tiles.
- Airbnb’s availability overlays often refresh just attributes (not geometry) for visible listings.
If your app overlays dynamic data (availability, status, etc.), mention attribute-only refreshes as a way to avoid reloading geometry.
5. Client-Side Clustering and LOD (Level of Detail)
When showing thousands of points or polygons, you don’t render them all at once. Libraries like Supercluster (by Mapbox) perform client-side aggregation so that:
- At low zoom levels, multiple polygons merge into one cluster.
- As you zoom in, clusters expand into their individual components.
You’ve seen one of these infinite-zoom GIFs. LOD is one way to achieve progressive detail as you keep zooming in.
This “LOD-based” visualization makes maps look both smooth and fast, even with millions of records.
6. Background Prefetching with Behavioral Prediction
Airbnb and Google Maps both use predictive prefetching: They track pan direction and prefetch the next likely tiles ahead of time.
Combined with your hysteresis concept, this ensures near-zero lag when users explore the map continuously in one direction.
7. Smart Expiry & Cache Invalidation/Busting
I already mentioned caching, but one powerful addition is data versioning to support cache busting or cache invalidation. Every polygon or tile set can have a version ID (e.g., wards_v23).
When you update data on the server, bump the version when serving the data to the frontend, the clients automatically know which cached data to invalidate.
This keeps stale data minimal without requiring manual cache purges.
Wrapping up
Interactive maps are data-heavy by nature—you can’t load everything at once, and you can’t keep reloading either. The goal is to make users feel like everything’s instantly available, even when it’s being streamed and cached smartly behind the scenes.
Start with debounced fetches, intelligent caching, and progressive rendering for immediate wins. As you scale, adopt architectural patterns like vector tiles and spatial indexing. That’s the path every serious map platform takes—and what separates a laggy demo from a production-grade experience.
References
-
Vector Tiles Standards & Mapbox Vector Tile Specification - Mapbox - https://docs.mapbox.com/data/tilesets/guides/vector-tiles-standards/ ↩︎
-
Douglas-Peucker Algorithm - Interactive Playground - https://cartography-playground.gitlab.io/playgrounds/douglas-peucker-algorithm/ ↩︎
-
Visvalingam–Whyatt Algorithm - Wikipedia - https://en.wikipedia.org/wiki/Visvalingam–Whyatt_algorithm ↩︎
-
Tippecanoe: Build vector tilesets from large datasets - GitHub - https://github.com/mapbox/tippecanoe ↩︎
-
Mapshaper: Tools for editing Shapefile, GeoJSON, TopoJSON and CSV files - GitHub - https://github.com/mbloch/mapshaper ↩︎
-
Line Simplification Algorithms - Comparison of Douglas-Peucker and Visvalingam–Whyatt - https://martinfleischmann.net/line-simplification-algorithms ↩︎
-
Mapbox: Adjust a tileset’s zoom extent - https://docs.mapbox.com/help/troubleshooting/adjust-tileset-zoom-extent/ ↩︎
-
H3: Uber’s Hexagonal Hierarchical Spatial Index - https://h3geo.org ↩︎
-
H3: Uber’s Hexagonal Hierarchical Spatial Index - Uber Blog - https://www.uber.com/en-US/blog/h3/ ↩︎
-
Visualizing City Cores with H3, Uber’s Open Source Geospatial Indexing System - Uber Blog - https://www.uber.com/en-EG/blog/visualizing-city-cores-with-h3 ↩︎